
Convert JSON array to table in Power BI
Suppose you have a JSON file that looks like this and you want to import it as a table into Power BI:
{ "fields": [ { "field": "field1", "type": "string" }, { "field": "field2", "type": "string" }, { "field": "field3" , "type": "integer" }, { "field": "eventTimestamp", "type": "date" } ], "results": [ [ "field1value1", "field2value1", 10, "26 Oct 2022 22 :01" ], [ "field1value2", "field2value2", 20, "28 Oct 2022 15:22" ], [ "field1value3", "field2value3", 30, "17 Oct 2022 12:46" ] ] }
This JSON file consists of two arrays:
- fields;
- results.
In the list “fields” shows the column names and what data type the column contains. In "results” the values of the relevant columns are displayed in a structured manner.
We have four columns:
- field1;
- field2;
- field3;
- eventTimestamp.
We want to import the JSON into Power BI as a tabular form, resulting in the table below.
| wdt_ID | field1 | field2 | field3 | eventTimestamp |
|---|---|---|---|---|
| 1 | field1value1 | field2value2 | 10 | 26 Oct 2022 22:01 |
| 4 | field1value2 | field2value2 | 20 | 28 Oct 2022 15:22 |
| 6 | field1value3 | field2value3 | 30 | 17 Oct 2022 12:46 |
Retrieving data from a source
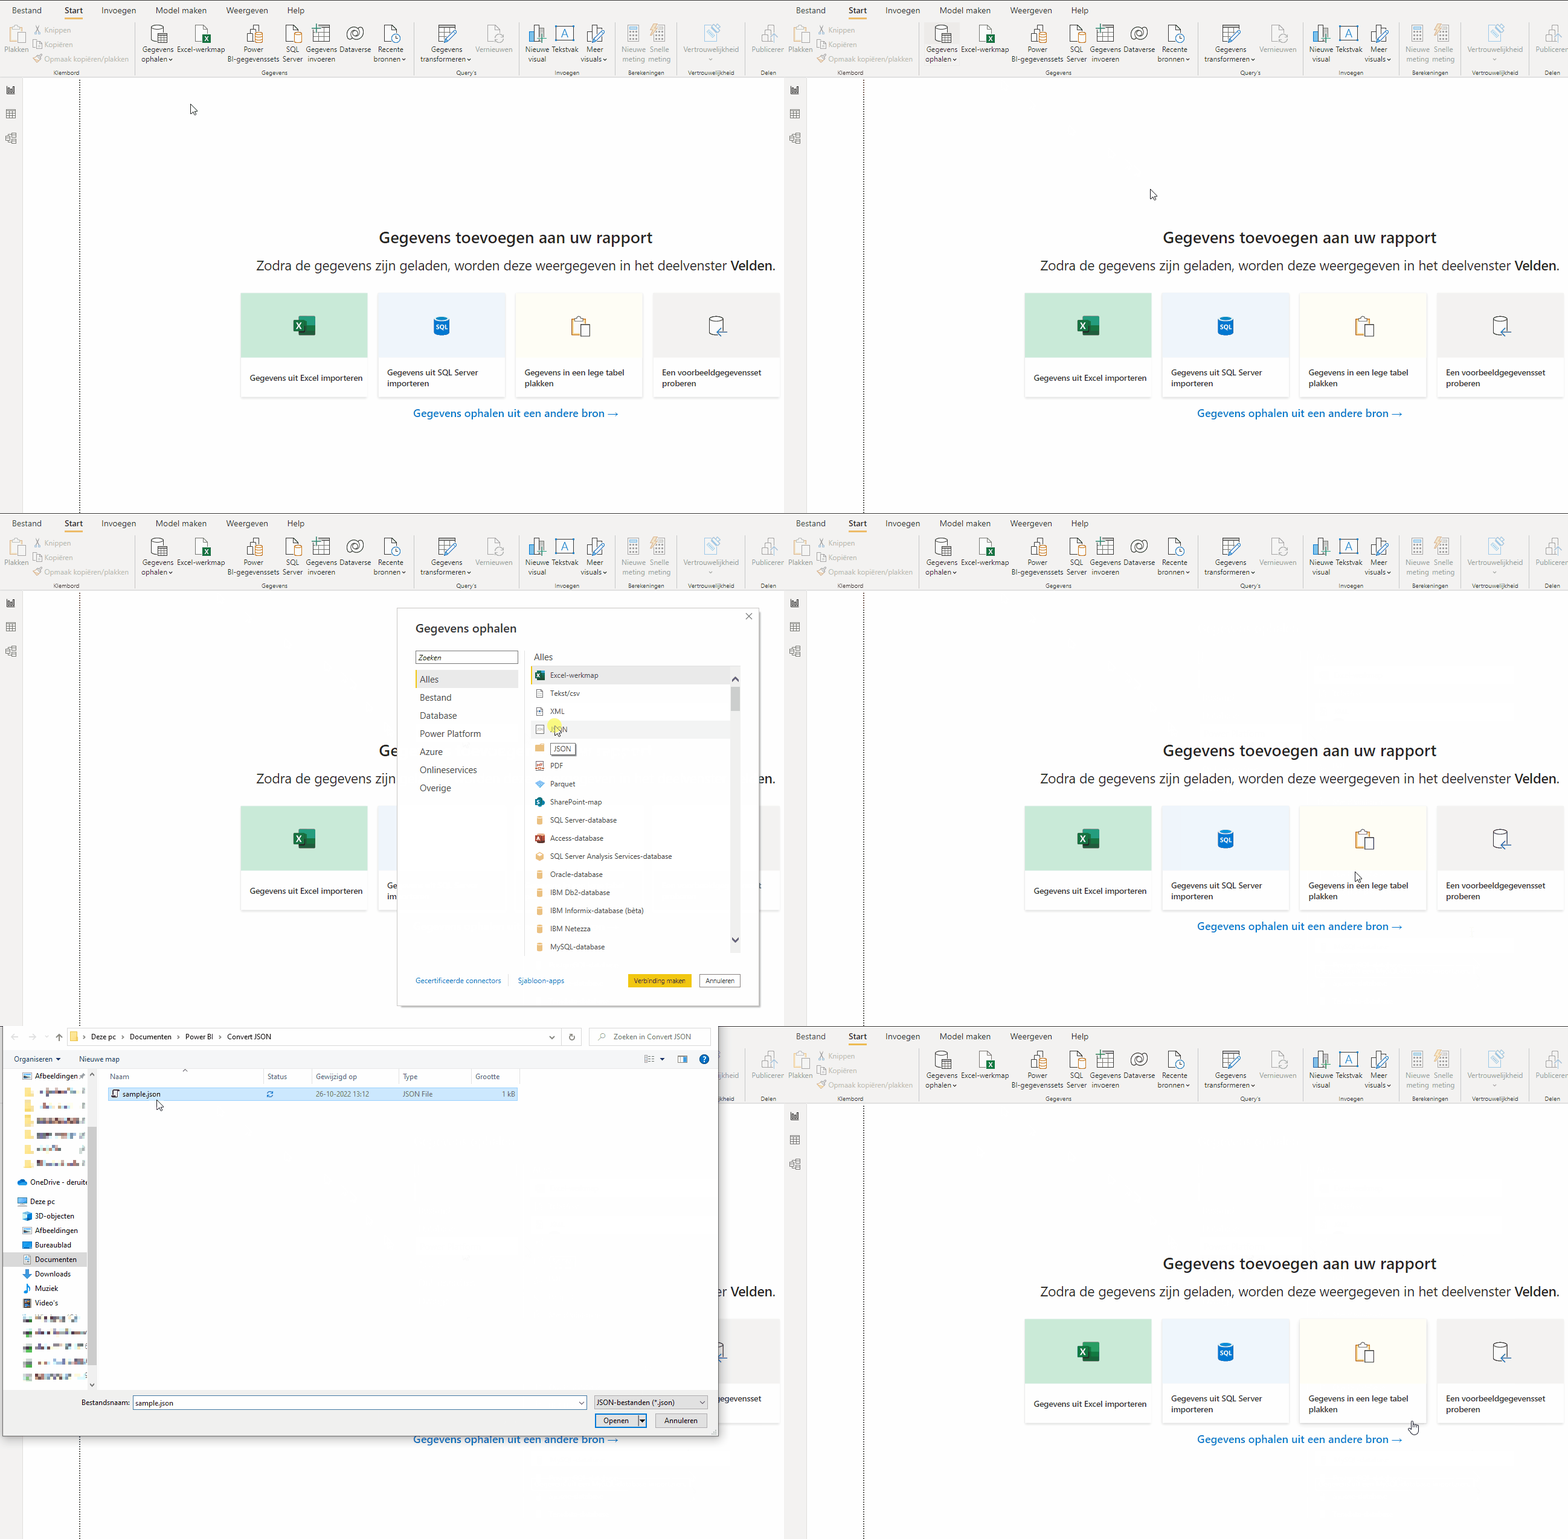
Start Power BI and create a new report.
We start by getting the data from the JSON file. For this we go to the tab Start and click the button Retrieve data.
A new window will open. If in the right column of the window you do not have a JSON You can enter “JSON” in the search box.
The Power Query Editor
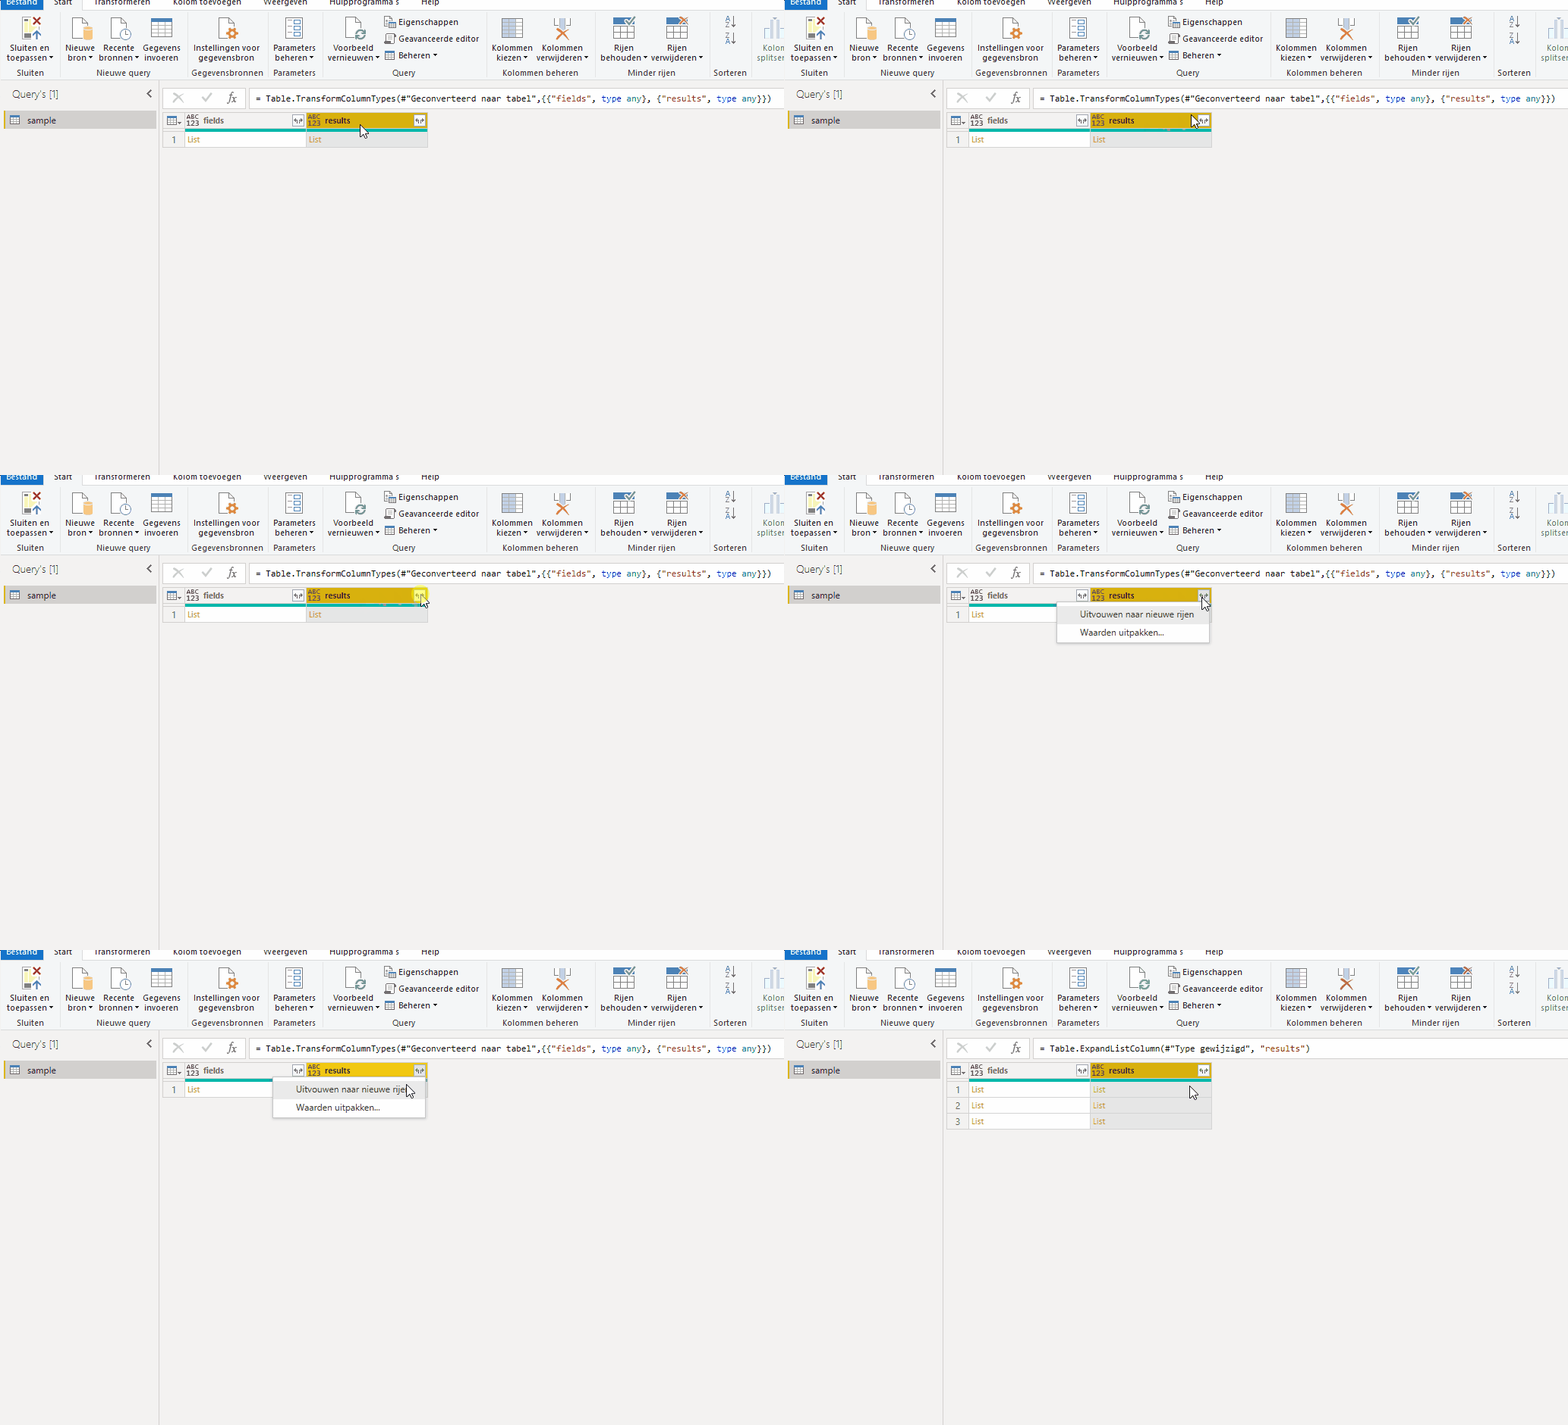
The Power BI Power Query Editor opens with the imported JSON file. In the table you see two columns called fields and results.

In the table there is one row with a list. Click next to the text list of the column “fields” and you will see at the bottom of your screen (in the preview) that it contains four records. These are the column names.
Click next to the text list of the column “results“. You can see that it contains three records. These are the number of rows.
Expand to Rows
Click in the column “results” on the button with the two arrows click on Expand to new rows.
The table has now expanded from one to three rows. Click next to the text list of the column “results” you will see the values of the row in question at the bottom of your screen (in the preview).
Add column
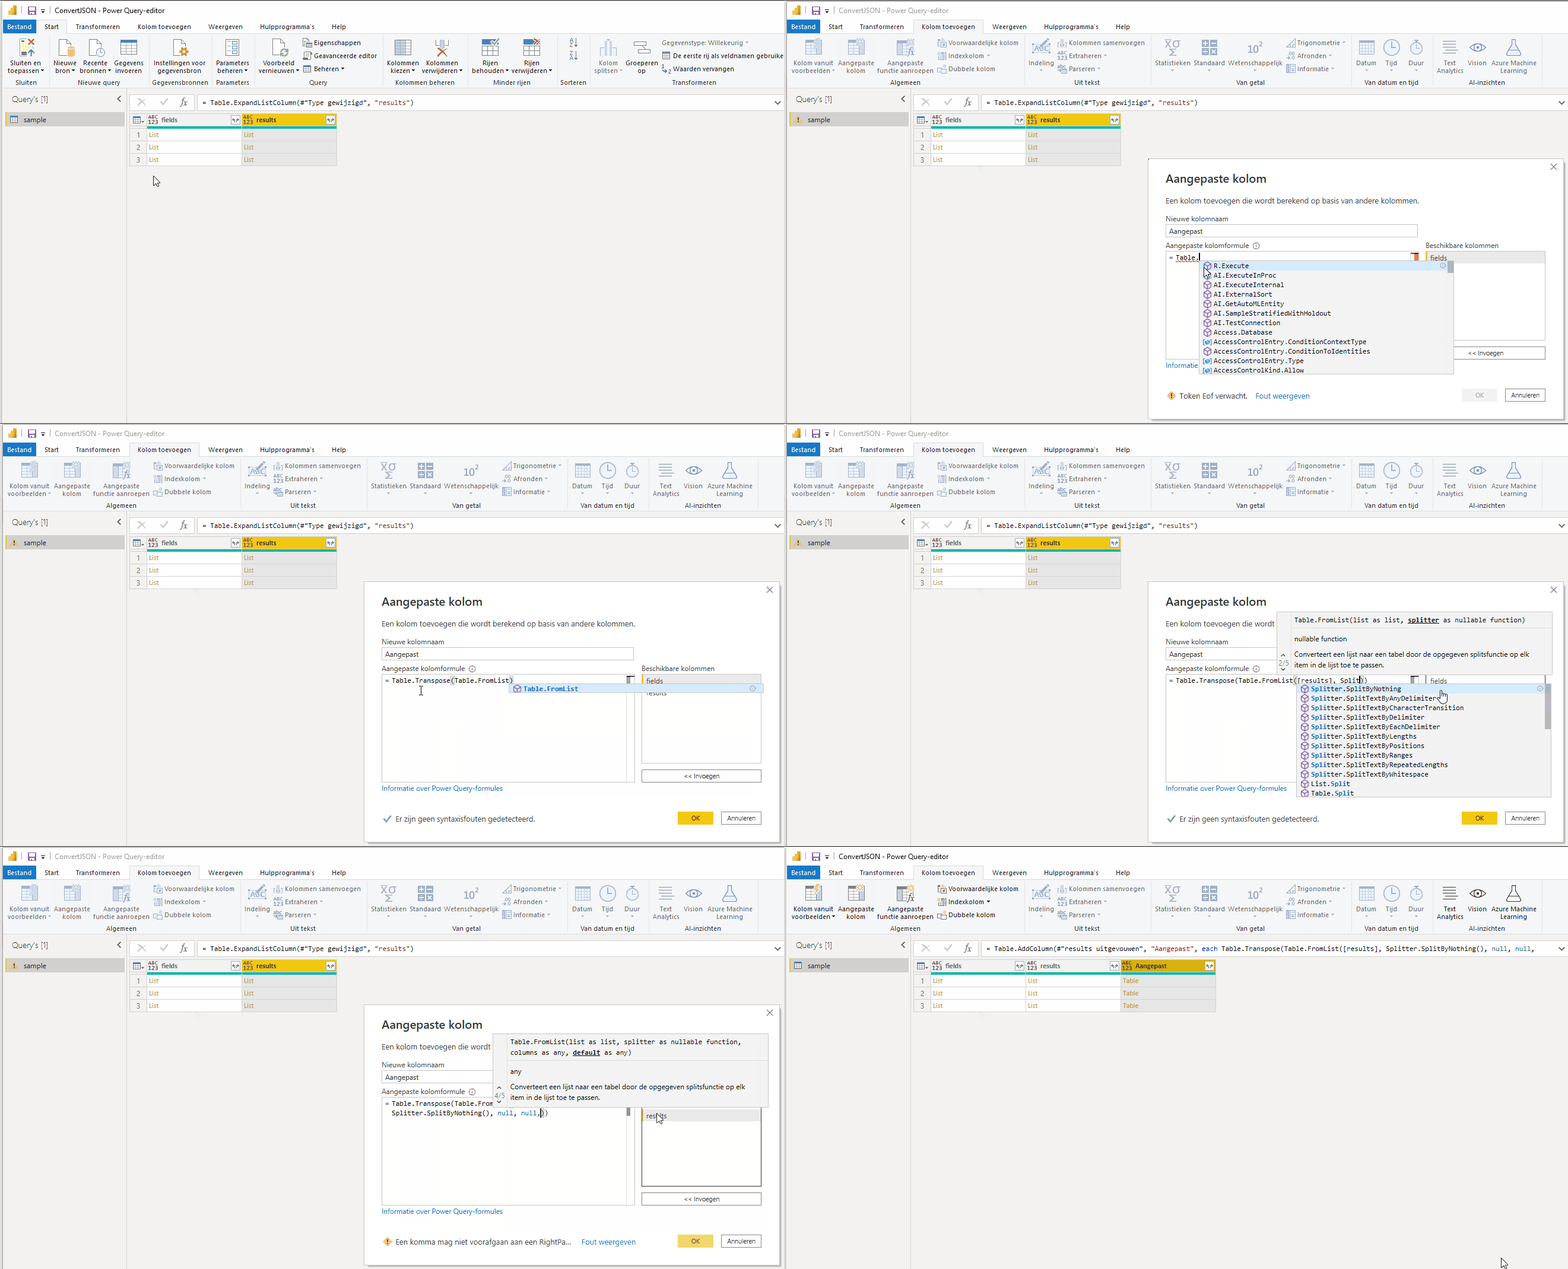
Click on the tab Add column and click the button Custom column. A new window will open. Fill in the following formula:
Table.Transpose(Table.FromList([results], Splitter.SplitByNothing(), null, null, ExtraValues.Error))
Delete other columns
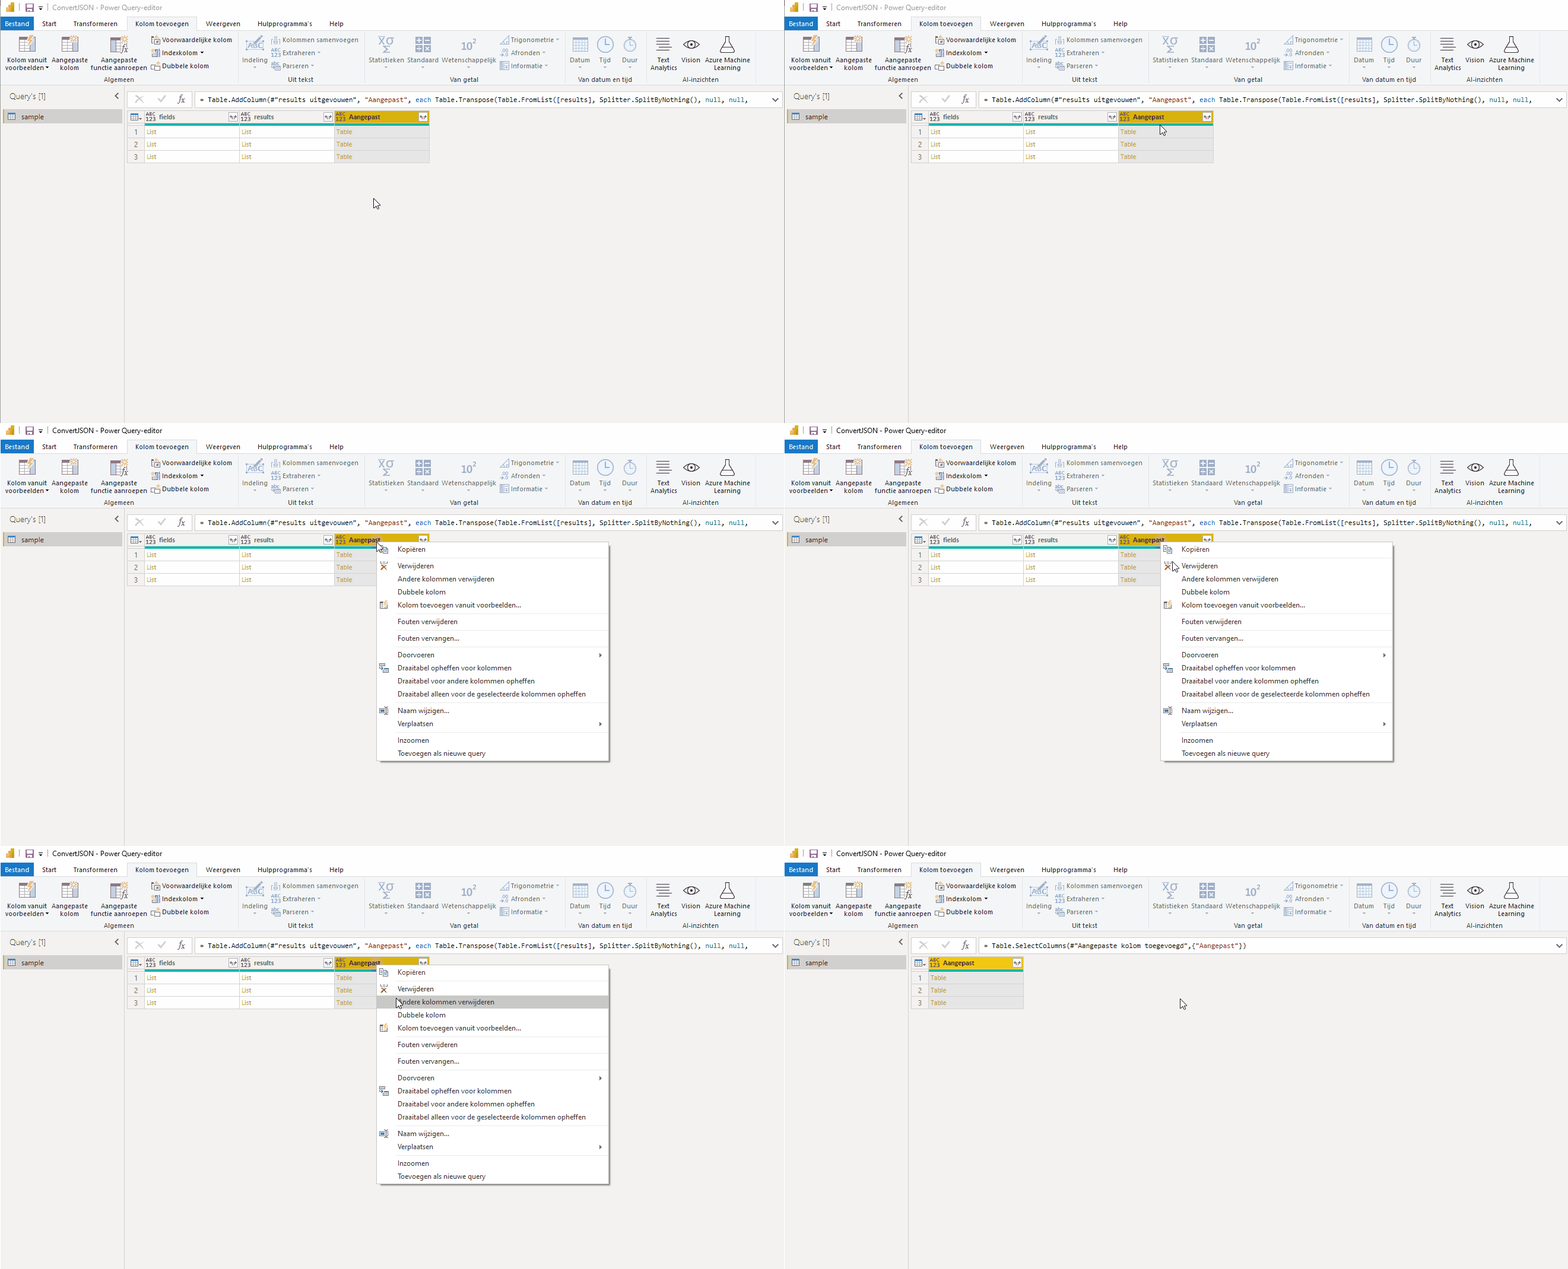
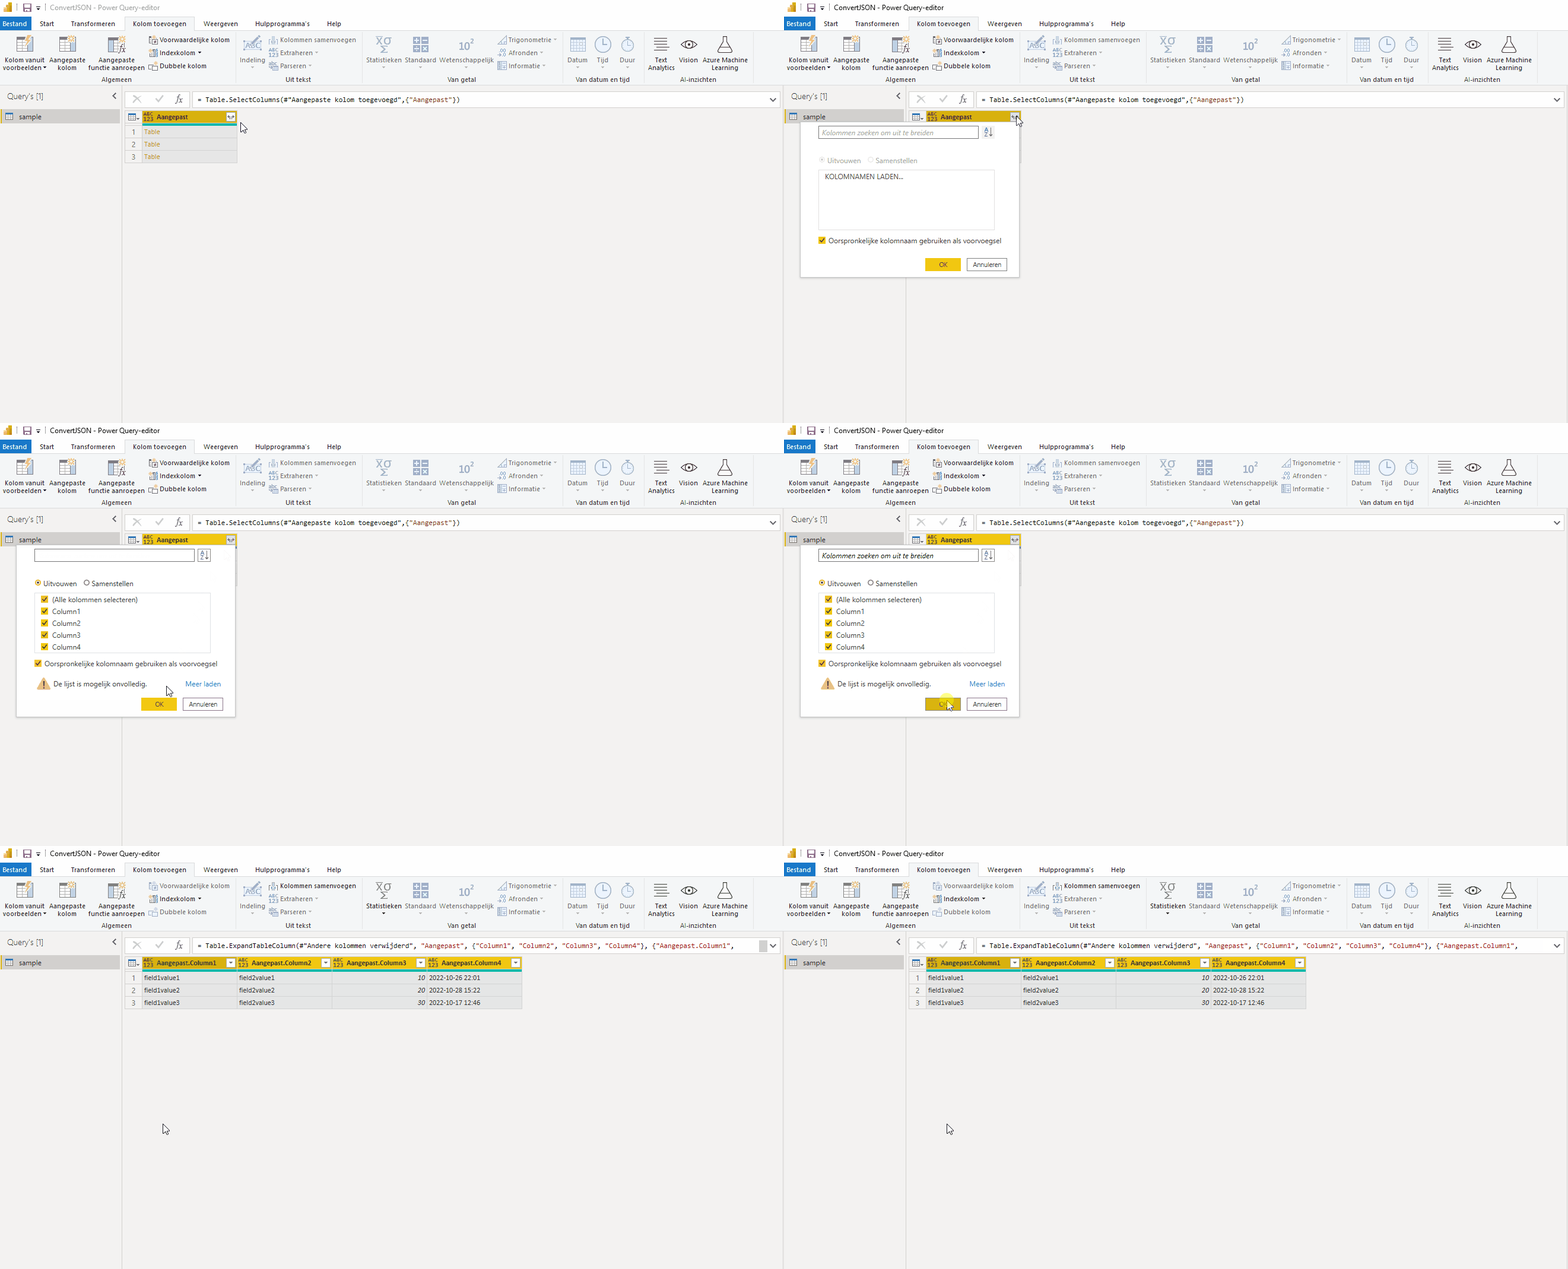
Right click on the column name “Amended” which has just been created and choose Delete other columns. You now only keep the column “Amended" about.
Expand column to rows
Click in the column “Amended” on the button with the two arrows and make sure the option “Unfold” is selected and click the “OK“.
Customize column names
The next step is to add column names which are in the JSON file. We do this by adjusting the current table names to the values in the column “fields“.
Add New Query
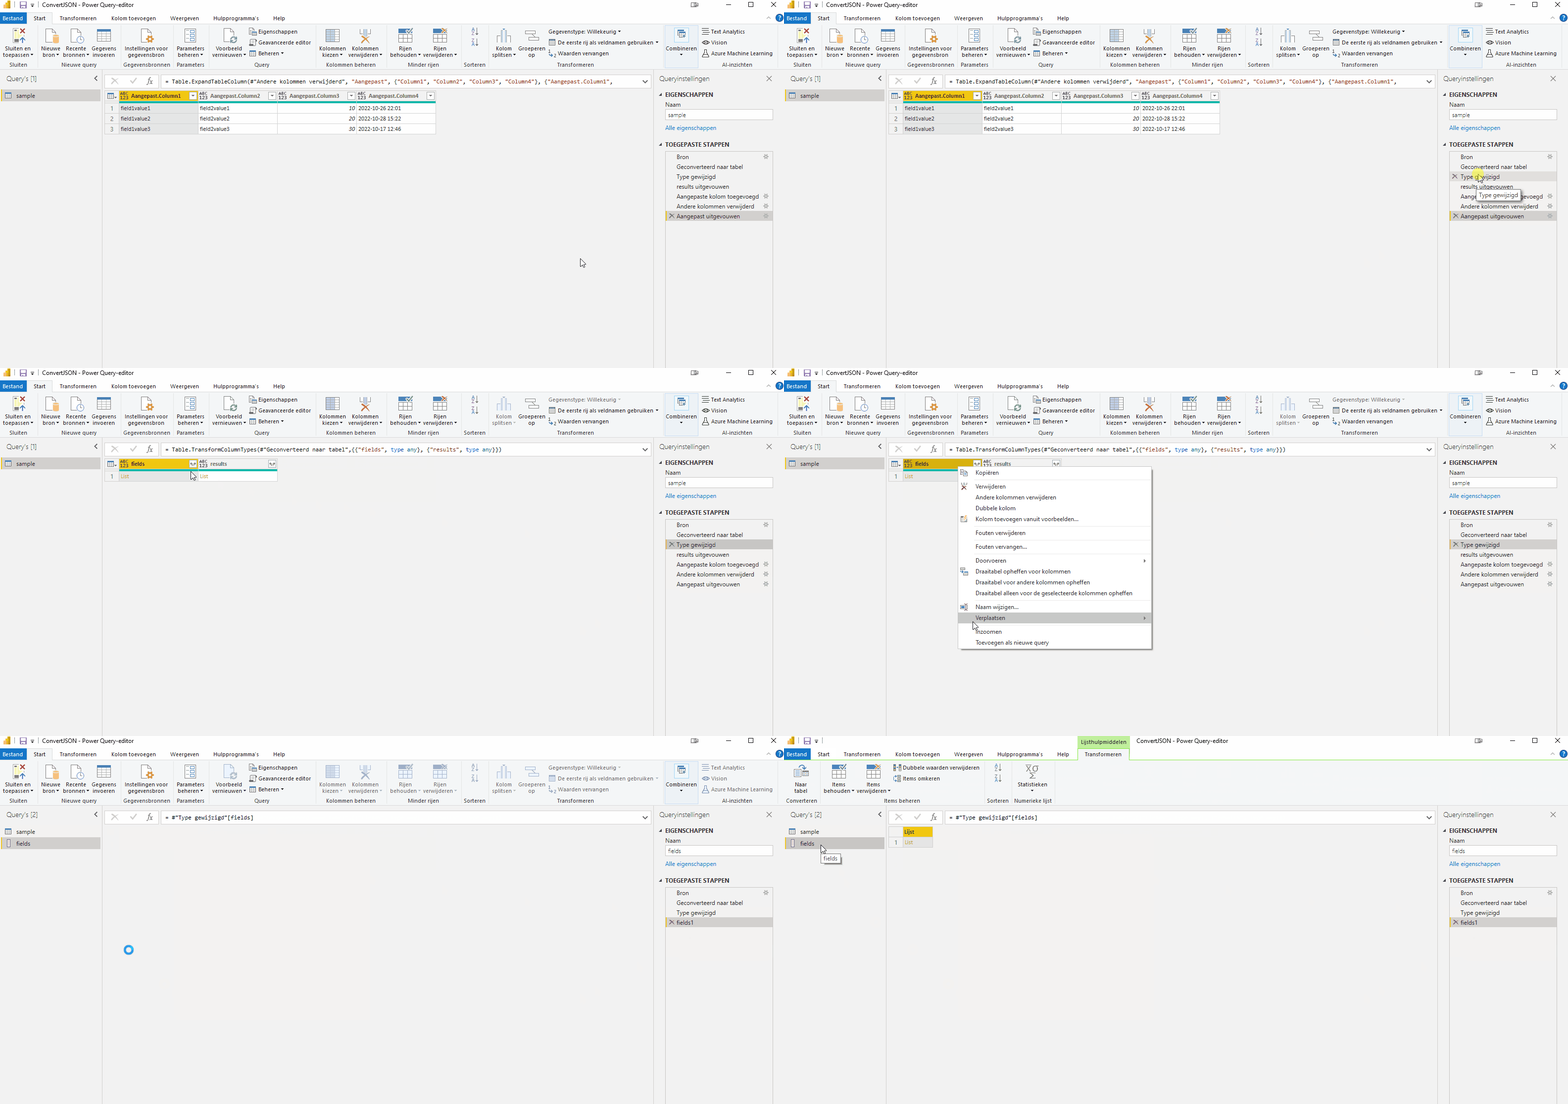
On the right side of the Power Query editor you can see the applied steps. Stand on the third step (Type changed) and then right-click on the column name “fields“. From the context menu choose Add as new query.
Convert to Table
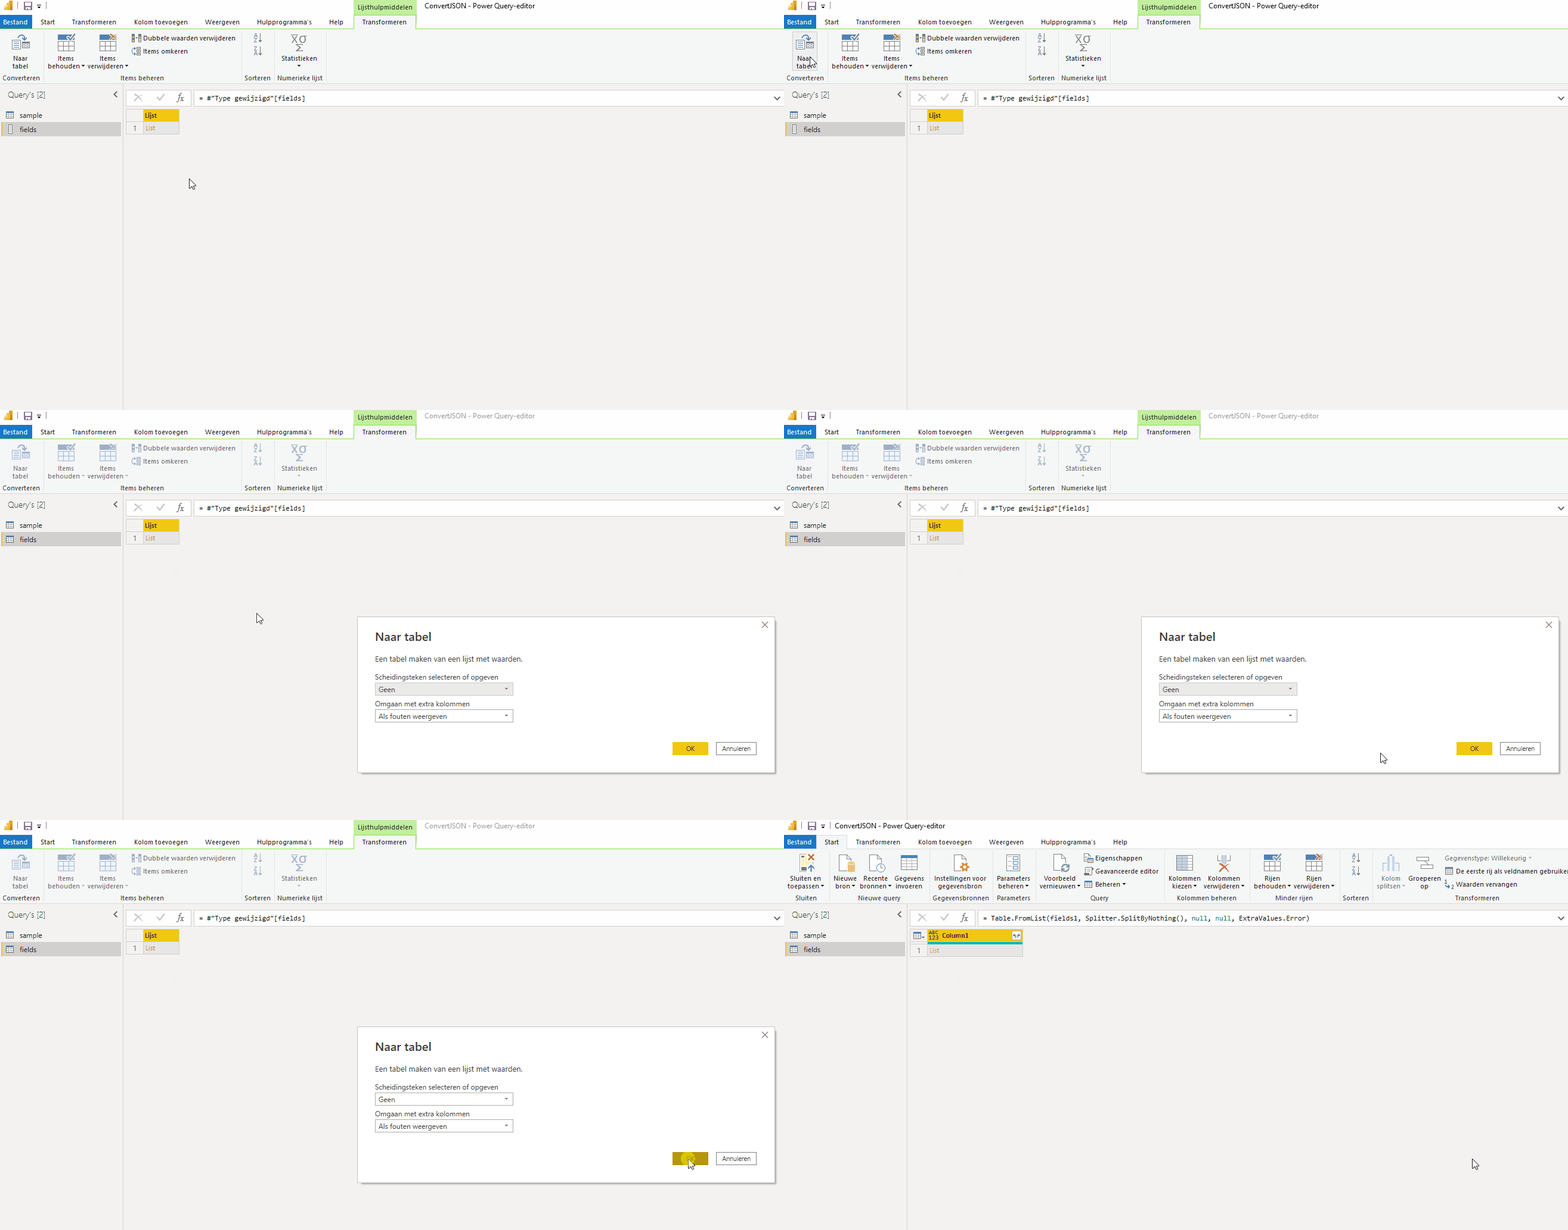
Go to the tab transform and click the button To table in the category To convert.
A new window will open (To table) and click here on the button “OK“.
Expand to new rows
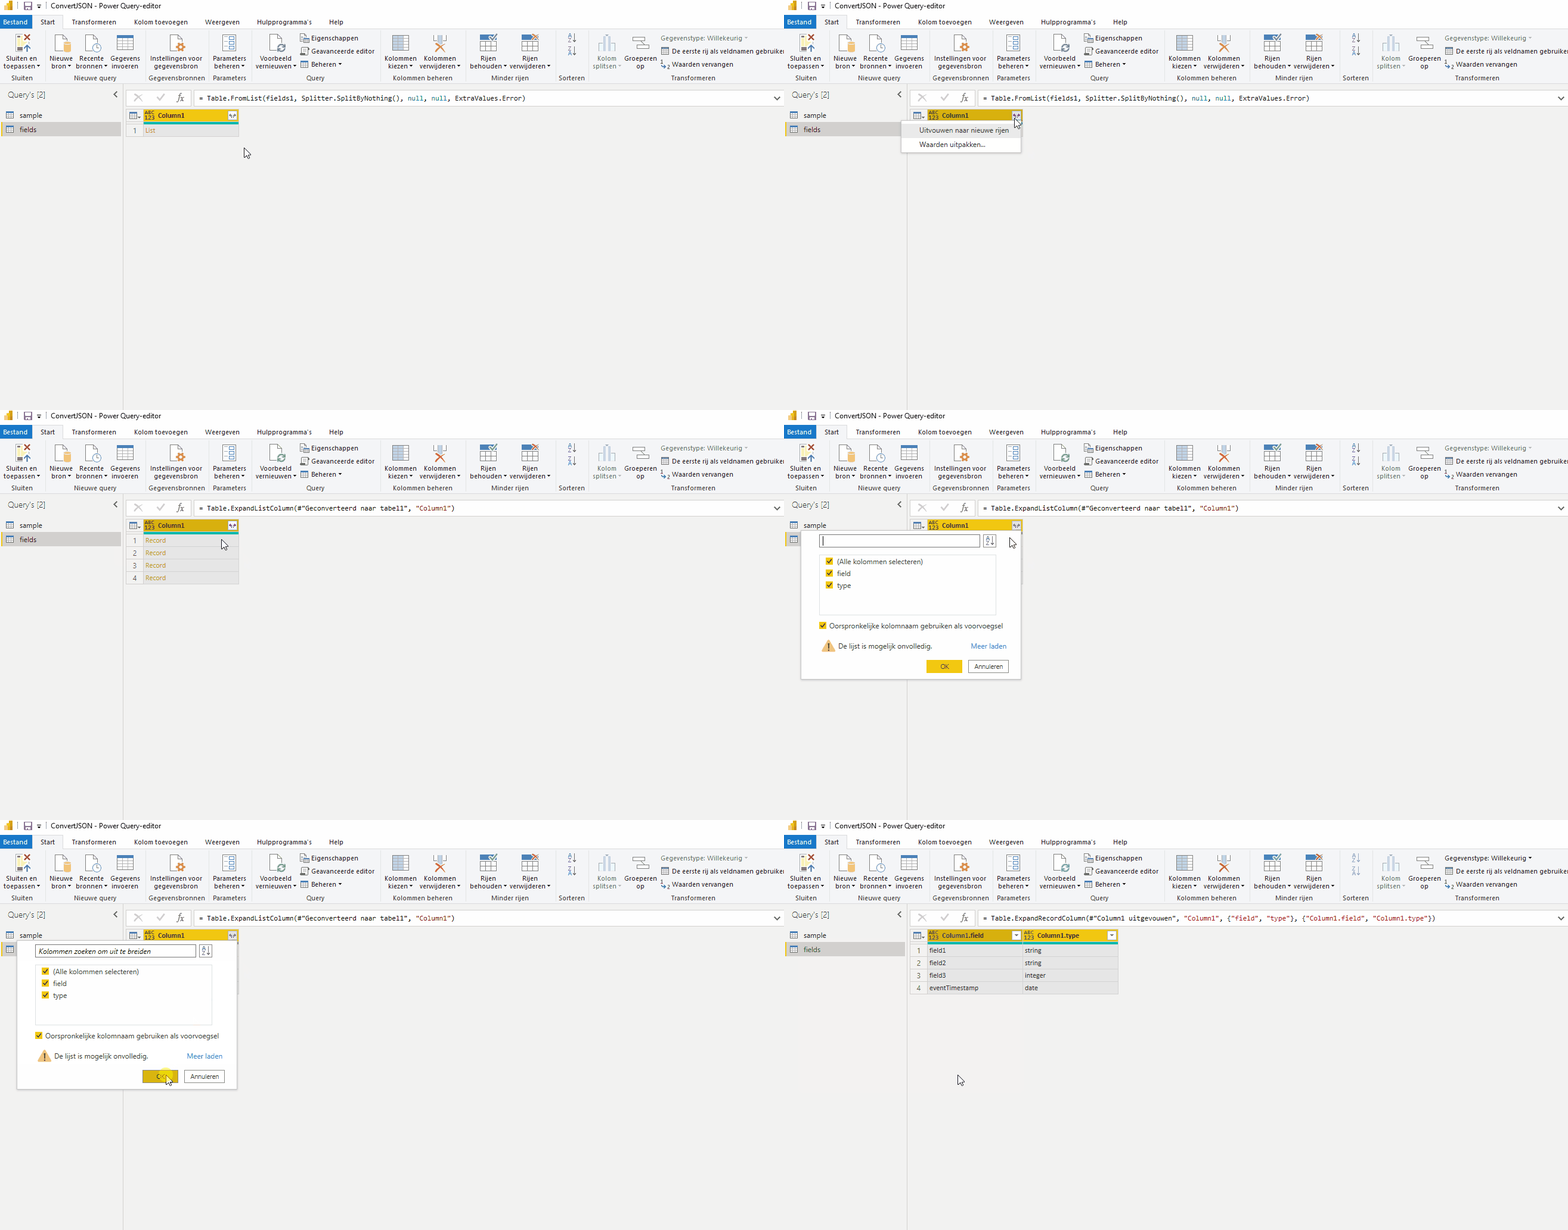
Click on the button with the two arrows of the column and choose Expand to new rows. After the rows have been expanded, click the button with the two arrows again. Press the button "OK“.
As a result, we see the column names in the first column and the data type in the second column.
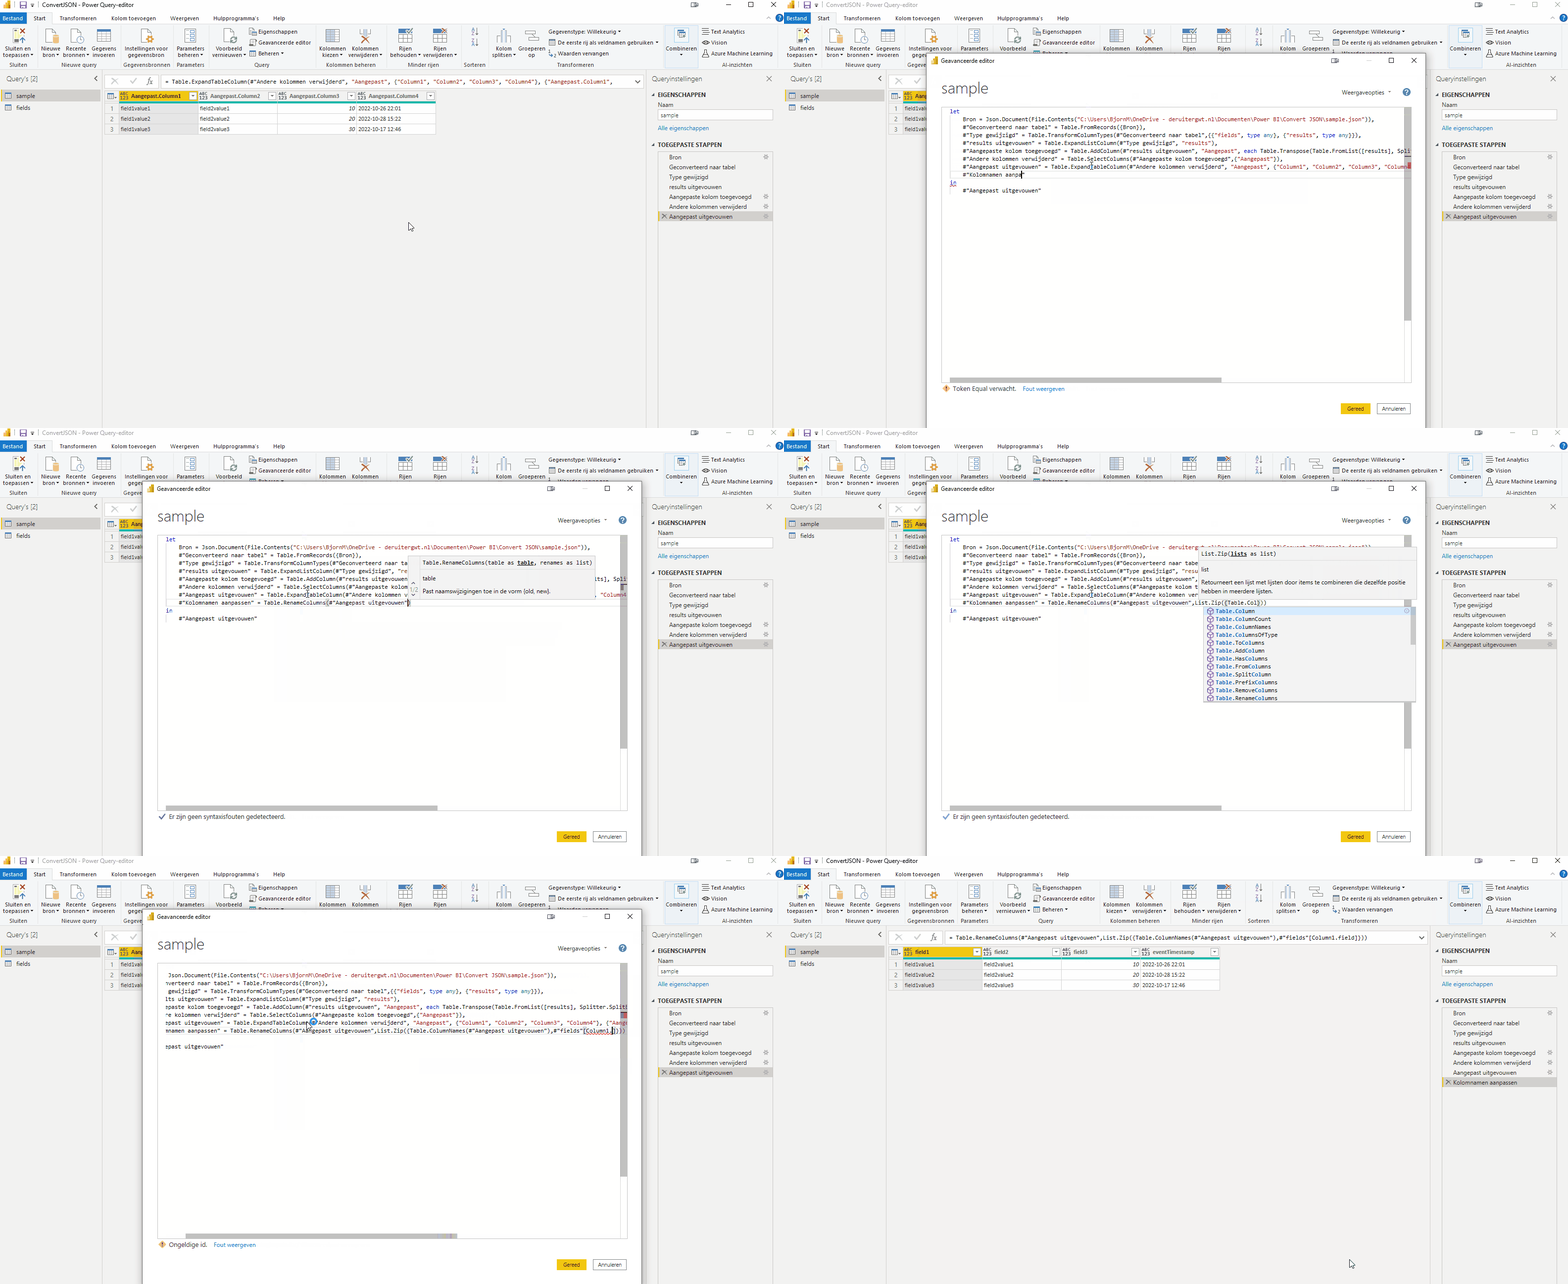
Customize column names in table of values
Select the table containing the data (sample). Then click from the tab Start on the button Advanced Editor in the category query.
A new window will open in which you can adjust the so-called M-code. Adjust the M-code to the example below.
let Source = Json.Document(File.Contents("C:\Users\BjornM\OneDrive - deruitergwt.nl\Documents\Power BI\Convert JSON\sample.json")), #"Converted to table" = Table.FromRecords ({Source}), #"Type changed" = Table.TransformColumnTypes(#"Converted to table",{{"fields", type any}, {"results", type any}}), #"results expanded" = Table.ExpandListColumn(#"Type changed", "results"), #"Custom column added" = Table.AddColumn(#"results expanded", "Custom", each Table.Transpose(Table.FromList([results], Splitter .SplitByNothing(), null, null, ExtraValues.Error))), #"Other columns removed" = Table.SelectColumns(#"Custom column added",{"Custom"}), #"Custom expanded" = Table.ExpandTableColumn (#"Other columns removed", "Custom", {"Column1", "Column2", "Column3", "Column4"}, {"Custom.Column1", "Custom.Column2", "Custom.Column3", " Custom.Column4"}), #"Custom Expanded Column Names" = Table.RenameColumns(#"Custom Expanded",List.Zip({Table.ColumnNames(#"Custom Expanded"),#"fields"[Column1.field]}) ) in #"Customize column names"
Then press the button “OK” to apply the changes. As a result, you will see that all column names have been modified.
Customize data type
The last step is to change the data type of each column. For this we use a function.
Create function
Click from the tab Start on New source and choose a Empty query.
Enter the code below and change the query name to "ConvertType“.
= (input as text) as type => let values = { {"string", type text}, {"integer", type number}, {"date", type datetimezone}, {input, type any} }, Result = List.First(List.Select(values, each _{0}=input)){1} in Result
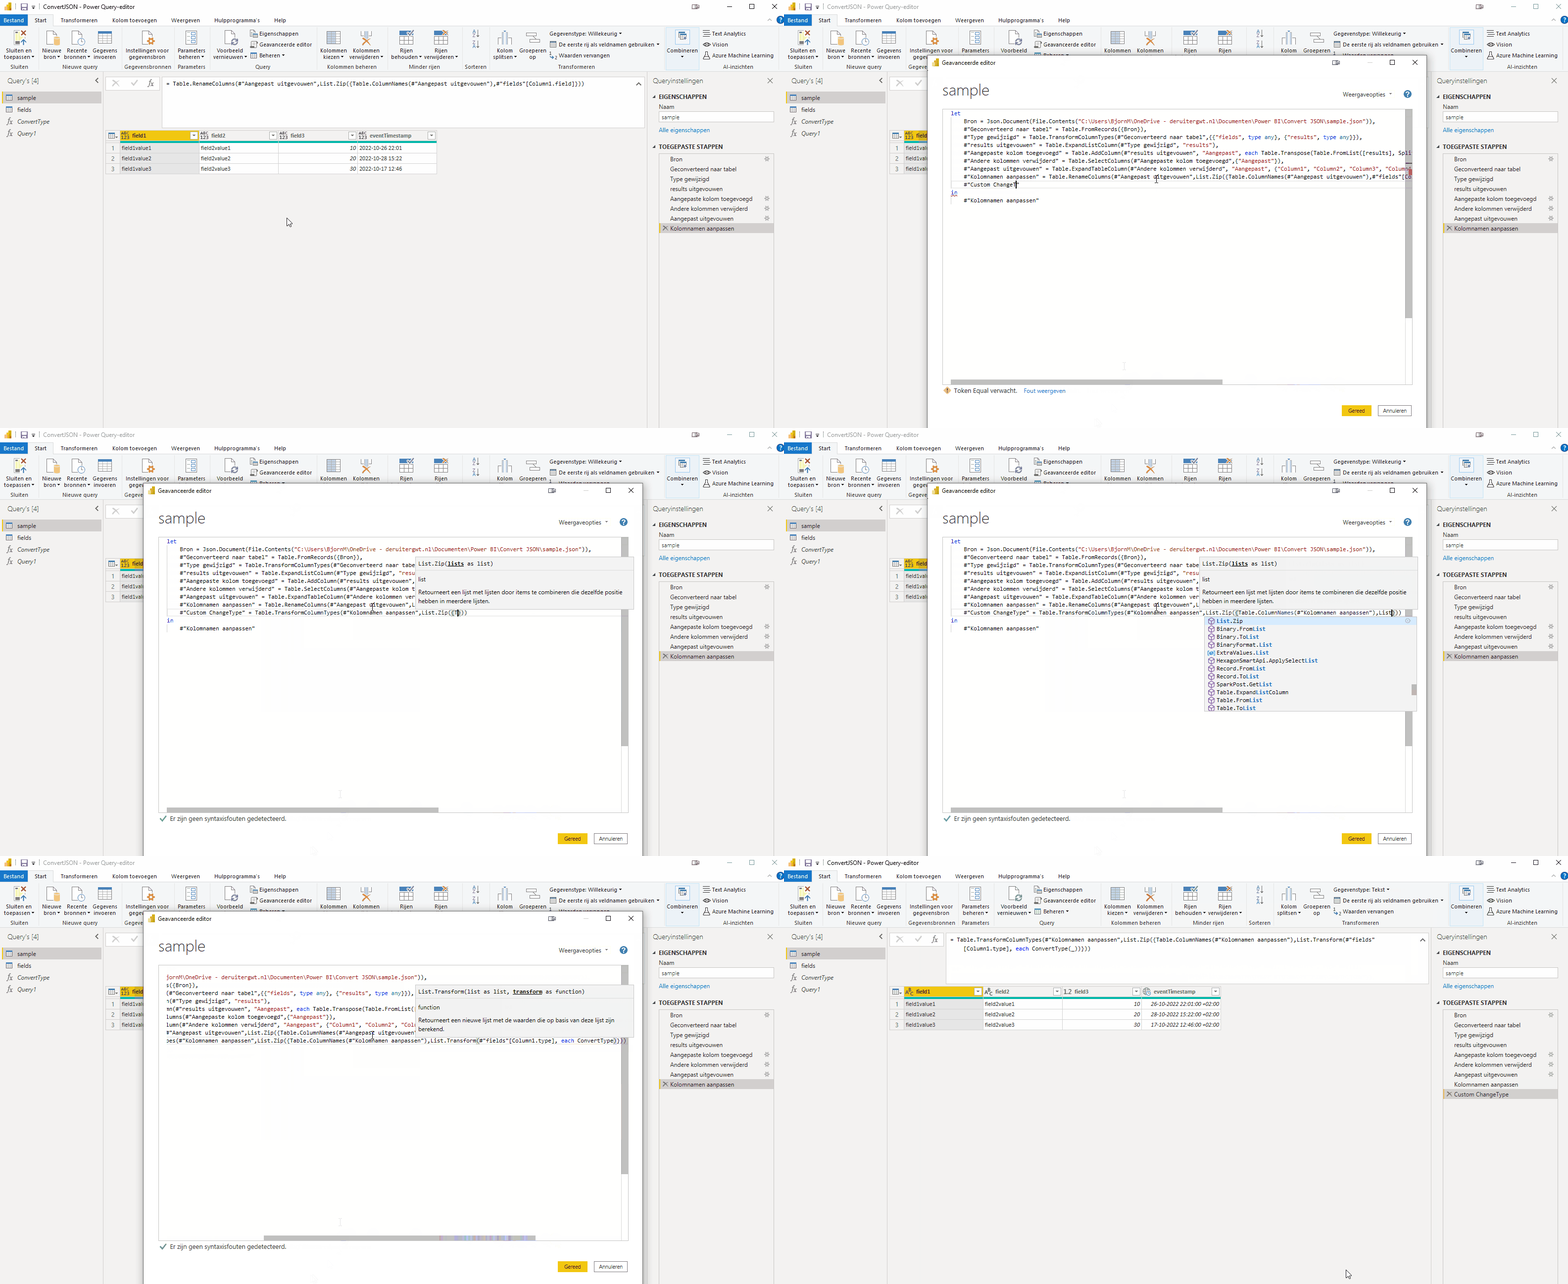
Edit data type of column names
In the table "results” let's add the last step to give each column the correct data type.
Select the table containing the data (sample). Then click from the tab Start on the button Advanced Editor in the category query.
A new window will open in which you can adjust the so-called M-code. Adjust the M-code to the example below.
let Source = Json.Document(File.Contents("C:\Users\BjornM\Downloads\Convert JSON\sample.json")), #"Converted to Table" = Record.ToTable(Source), #"Expanded Value" = Table.ExpandListColumn(#"Converted to Table", "Value"), #"Filtered Rows" = Table.SelectRows(#"Expanded Value", each ([Name] = "results")), #"Added Custom" = Table.AddColumn(#"Filtered Rows", "Custom", each Table.Transpose(Table.FromList([Value], Splitter.SplitByNothing(), null, null, ExtraValues.Error))), #"Removed Other Columns " = Table.SelectColumns(#"Added Custom",{"Name", "Custom"}), #"Expanded Custom" = Table.ExpandTableColumn(#"Removed Other Columns", "Custom", {"Column1", " Column2", "Column3", "Column4"}, {"Custom.Column1", "Custom.Column2", "Custom.Column3", "Custom.Column4"}), #"Removed Columns" = Table.RemoveColumns(# "Expanded Custom",{"Name"}), #"Custom Rename" = Table.RenameColumns(#"Removed Columns",List.Zip({Table.ColumnNames(#"Removed Columns")),#"fields"[field ]})), #"Custom ChangeType" = Table.TransformColumnTypes(#"Custom Rename",List.Zip({Table.ColumnNames(#"Custom Rename")),List.Transform(#"fields"[Column1.type] , each ConvertType(_))})) in #"Custom ChangeType"
Then press the button “OK” to apply the changes. As a result, you see that the data types of all columns have been adjusted.
Downloads
If you can't figure it out with the above guide alone, download the sample file or ask a question by leaving a message.
Dit delen:
- Klik om te delen met Twitter (Wordt in een nieuw venster geopend)
- Klik om te delen op Facebook (Wordt in een nieuw venster geopend)
- Meer
- Klik om dit te e-mailen naar een vriend (Wordt in een nieuw venster geopend)
- Klik om op LinkedIn te delen (Wordt in een nieuw venster geopend)
- Klik om te delen met Reddit (Wordt in een nieuw venster geopend)
- Klik om op Tumblr te delen (Wordt in een nieuw venster geopend)
- Klik om te delen op Telegram (Wordt in een nieuw venster geopend)
- Klik om te delen op WhatsApp (Wordt in een nieuw venster geopend)
